AWS Cost Optimization: When the Bill Grows Faster Than the Business

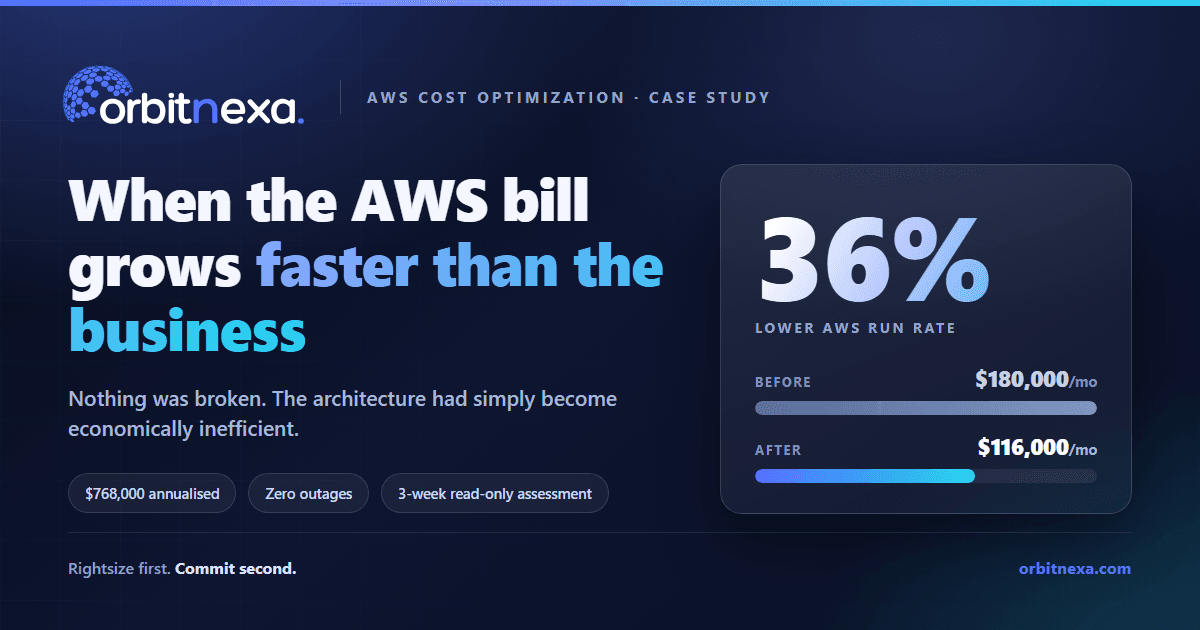
The bill was growing faster than the business. Nothing was broken — the architecture had simply become economically inefficient. Here's what the assessment found, what it saved, and the order the work has to happen in.
*How a growing platform cut its AWS run rate by 36% - without sacrificing performance, availability, or engineering velocity.*
About this case study. The company below is an illustrative composite, not a client engagement. The figures are representative of programmes of this shape and are included to show how the economics work, not to report a specific customer outcome. The method, access model and guarantee described at the end are real.
The Situation: Everything Was Working. The Bill Wasn’t.
AWS cost optimization usually becomes urgent not when something breaks, but when nothing does. That was the case here. Revenue was growing. Customers were signing up. Transactions were increasing. The production platform was stable, with no major outage, no infrastructure failure, and no obvious runaway resource.
And yet one number was moving in the wrong direction.
The AWS bill was growing faster than the business.
The company had reached roughly $180,000 in monthly AWS spend. Cloud usage had grown alongside the product, but cloud expenditure was now increasing faster than revenue. Nothing was technically broken. The architecture was simply becoming economically inefficient.
The environment spanned production and non-production workloads across Amazon EC2, Amazon RDS, Amazon S3, Amazon EBS, Amazon CloudWatch, NAT Gateway, and data transfer. The engineering team had been focused on what mattered most to them: shipping features, supporting customers, and keeping the platform reliable.
FinOps had not kept pace with that growth. Gartner estimates organizations waste up to 30% of their cloud spend, and most only discover it when the invoice arrives. This company was living that statistic.
The Cost Snapshot
The first step was to turn the monthly bill into something leadership and engineering could reason about.
| Cost Area | Monthly Spend | Share |
|---|---|---|
| Compute | $72,000 | 40% |
| Database | $38,000 | 21% |
| Storage | $21,000 | 12% |
| Network | $19,000 | 11% |
| Observability | $16,000 | 9% |
| Other AWS Services | $14,000 | 8% |
| Total | $180,000 | 100% |
The obvious reaction was to attack the largest number: compute. That would have been too simplistic. The real question was not "Which AWS service costs the most?" It was:
Where are we paying for capacity, data, or infrastructure that the business no longer needs?
Why the Bill Grows Faster Than the Business
Usually because of dozens of small, individually reasonable decisions rather than one expensive service. A team scales an instance because traffic increased. A database gets extra capacity because a previous peak caused concern. A development environment stays running because nobody wants to wait for it to start. Logs are retained indefinitely because storage feels cheap next to the cost of losing diagnostic information. An old EBS volume sits attached to nothing because its owner moved to another project.
None of these decisions looks catastrophic. Together, they become a significant monthly bill. Two examples from this estate make the pattern concrete.
Example 1: EC2 - The Instance That Never Got Resized
A workload had originally been placed on a large EC2 instance because it genuinely needed the capacity during a period of rapid growth. Six months later the traffic pattern had changed. The application was still running on the same instance size, showing low average CPU and memory utilisation, large gaps between average and peak demand, and more baseline capacity than the workload required.
The answer was not simply "use fewer EC2 instances." It was to right-size the workload based on actual behaviour - evaluating instance size, scaling policies, workload peaks and application performance before recommending any change, then assessing Graviton-based instance families where the workload was compatible.
Example 2: CloudWatch - The Logs Nobody Was Paying Attention To
The application generated large volumes of logs, and the logs were useful. The problem was that almost everything was retained for a long time regardless of whether it stayed operationally useful. Nobody noticed, because the application kept working perfectly.
The optimization was not "delete logs." It was to determine the retention actually required per log group, reduce unnecessary ingestion at source, remove duplicate and excessively verbose logging, move appropriate groups to a lower-cost log class, archive historical logs to object storage - and preserve everything required for operations, security and compliance.
That is the difference between cutting cost and cost engineering.
Is your AWS bill growing faster than your business?
A fixed-price, three-week, read-only assessment that identifies where you're overspending, what it's worth annualised, and what to fix first.
Request an AWS Cost Assessment →
No production changes. Read-only access. No application or customer data. Best fit for AWS estates above $40,000/month.
Where the Savings Actually Come From
Across the estates we assess, savings concentrate in a predictable set of levers. The ranges below are each lever’s typical contribution as a percentage of annualised baseline spend, in environments without a continuous FinOps practice.
| Lever | Typical contribution to baseline |
|---|---|
| Commitment coverage gap (Savings Plans / Reserved Instances) | 8-18% |
| Kubernetes bin-packing and node-group density | 4-15% |
| EC2 / RDS rightsizing against observed utilisation | 5-12% |
| Graviton migration candidates | 3-8% |
| Non-production environment scheduling | 3-8% |
| Data transfer and NAT Gateway topology | 2-7% |
| Storage class and lifecycle (S3, EBS gp2 to gp3, snapshots) | 2-6% |
| Idle and orphaned resources (Elastic IPs, volumes, load balancers) | 1-4% |
| Log retention and CloudWatch ingestion | 1-3% |
These ranges are not additive. They overlap, and no estate carries all of them - this one had no Kubernetes footprint at all. Which levers apply to you is the question an assessment answers. If your estate has no non-production environments and Savings Plans coverage already above 85% at high utilisation, the addressable waste is much smaller than the headline number in any case study, including this one.
The Clearest Example of Silent Cost: Amazon EKS Extended Support
For estates that do run Kubernetes, there is no cleaner illustration of how a cloud bill grows without anyone deciding anything. Amazon EKS charges a per-cluster, per-hour fee for the control plane, and the rate depends on which Kubernetes version the cluster is running.
| Kubernetes version support tier | Rate per cluster | Approx. per cluster, per month |
|---|---|---|
| Standard support - the first 14 months after a version is released in Amazon EKS | $0.10 per hour | ~$73 |
| Extended support - the following 12 months | $0.60 per hour | ~$438 |
The $0.60 is inclusive of the $0.10, not additional. So a cluster that simply stays on its Kubernetes version past the end of standard support costs six times more to run - roughly $365 more per cluster, per month - with no change in what it does, no additional workload, and no decision recorded anywhere. Across ten clusters spanning production, staging and development, that is about $43,800 a year for standing still.
Nobody chose to spend it. The version simply aged.
It is also entirely avoidable, and it is exactly the kind of finding an assessment surfaces in the first week: upgrade the cluster, or make the extended-support cost a deliberate, budgeted decision rather than an accident. Current rates are on the Amazon EKS pricing page.
How the Work Ran
One point worth being explicit about, because most cost-optimization pitches leave it vague: the assessment is read-only. We make no changes to your AWS environment. We find the waste, quantify it, rate its risk and sequence it. Your team implements.
| Stage | What happens | Who does it |
|---|---|---|
| 1. Discover | Build the cost model from 90 days of Cost and Usage Report and CloudWatch data; map spend to account, workload and owner | Orbitnexa (read-only) |
| 2. Quick wins | Idle resources, unattached volumes, orphaned IPs, always-on non-production - each costed, each with a rollback | Found by us, executed by you |
| 3. Architecture | Rightsizing, storage classes and lifecycle, network paths and database sizing, modelled against observed behaviour | Modelled by us, implemented by you |
| 4. Commitments | Savings Plans and RI coverage against the optimised baseline, as staged tranches rather than one purchase | Modelled by us, purchased by you |
| 5. Validation | Every change measured against latency, error rate, throughput and availability before it counts as a saving | Metrics set by us, measured by you |
| 6. Governance | Tagging taxonomy, budgets, anomaly alerts, and a monthly and quarterly review cadence | Designed by us, owned by you |
Stage 4 comes late on purpose. Savings Plans and Reserved Instances reduce the price of usage; they do not reduce usage. Committing before you understand your real baseline locks you into a discounted rate for capacity you may not need, for one or three years, with no exit.
Should you buy Savings Plans before or after rightsizing? After. Always after. You do not buy commitments for waste.
The Results: A 36% Reduction, Zero Outages
The assessment took three weeks. The platform team implemented the backlog over the following two quarters, sequenced by priority.
| Cost Area | Before | After | Reduction |
|---|---|---|---|
| Compute | $72,000 | $43,000 | 40% |
| Database | $38,000 | $27,000 | 29% |
| Storage | $21,000 | $14,000 | 33% |
| Network | $19,000 | $12,000 | 37% |
| Observability | $16,000 | $8,000 | 50% |
| Other AWS Services | $14,000 | $12,000 | 14% |
| Total | $180,000 | $116,000 | 36% |
$64,000 a month. 35.6%. $768,000 annualised. Three weeks of assessment, two quarters of phased implementation, and zero production outages caused by the programme - because every change carried a defined rollback and had to clear its performance metrics before it counted as a saving.
These figures are illustrative and demonstrate the economics of the model. They do not represent a reported Orbitnexa customer engagement.
The Same Model at Smaller Scale
Large estates make impressive headline numbers, but the method does not require one. The same programme on a $52,000/month estate:
| Cost Area | Before | After |
|---|---|---|
| Compute | $19,000 | $12,000 |
| Database | $11,000 | $8,000 |
| Storage | $7,000 | $5,000 |
| Network | $6,000 | $4,000 |
| Observability | $5,000 | $3,000 |
| Other AWS Services | $4,000 | $3,000 |
| Total | $52,000 | $35,000 |
A $17,000 monthly reduction - roughly 33%, or $204,000 annualised. The percentage is lower than the larger estate, which is typical: smaller environments carry less commitment leverage and fewer non-production environments to schedule. The work is the same work.
Three Lessons
1. The biggest AWS cost is not always the biggest waste. A large bill does not mean a service is inefficient. A $70K compute bill may be entirely justified, while a smaller network or storage pattern contains a far larger percentage of avoidable spend. A large production database may be necessary; a small development database running 24/7 is not.
2. Cost optimization is an engineering problem. There is a dangerous version of this work: delete resources until the bill goes down. Real optimization asks what the resource supports, what demand it serves, what happens at peak, what reliability and compliance requirements depend on it, what the saving is worth, and how the change gets reversed if it goes wrong. The best optimization improves economics without creating a larger technical problem somewhere else.
3. Savings don’t stay saved automatically. Six months later, new workloads get deployed, temporary environments become permanent, logs accumulate, storage grows and traffic patterns change. The bill starts climbing again. That is why FinOps cannot be a one-time cleanup project - and why Stage 6 exists, despite being the stage most programmes skip.
The objective is not to spend as little as possible. It is to get the highest business value from every AWS dollar.
Frequently Asked Questions
How do I reduce my AWS bill without hurting performance?
Start with measurement, not deletion. Map spend by workload and owner, remove genuinely idle resources first, then right-size compute and databases against actual utilisation data rather than assumption. Validate every change against latency, error rates and availability before counting it as a saving - and write the rollback before you make the change.
Should I buy Savings Plans before or after rightsizing?
After. Rightsize first, then commit. Buying commitments against an unoptimised baseline locks in a discounted price for capacity you may not need, for one or three years, with no exit. Once the environment reflects real demand, commitments safely reduce the effective rate on the usage that remains - and are best bought as staged tranches rather than a single purchase.
Do you make changes to our AWS environment?
No. The assessment is entirely read-only, and we request no write, modify or delete permission at any point. We produce a costed, risk-rated, sequenced backlog with a rollback path for every item; your engineering team implements it. Implementation support can be scoped separately if you want it.
What if you don’t find 20%?
You get a full refund of the fee, and you keep every deliverable. The guarantee is measured against savings we identify and evidence at High or Medium confidence, against a baseline agreed in writing in the first week - not against savings you subsequently realise, which depend on your implementation.
Does this work for Kubernetes and serverless estates?
Kubernetes, yes - emphatically. Bin-packing, node-group density, pod request-versus-usage gaps and control-plane version drift are among the largest and most commonly missed levers, often 4 to 15% of baseline on their own. Predominantly serverless estates are a different story: they are usually already efficient, the rightsizing levers largely do not apply, and we will tell you that rather than sell you an assessment.
See It Against Your Own Estate
The fastest way to judge a cost model is to point it at the bill you are actually worried about. Our AWS Cost Optimization Sprint is a fixed-price, three-week, read-only assessment. It produces a costed, risk-rated, sequenced remediation backlog - every finding with an annualised saving, an effort estimate, a risk rating and a rollback path - plus a commitment strategy and a FinOps operating model.
We identify at least 20% in evidence-backed savings opportunities across your annualised AWS spend - or we refund 100% of the fee. Measured against a baseline agreed in writing in week one, on findings we evidence at High or Medium confidence. Realised savings depend on which of those findings you implement.
Read-only throughout. You deploy a scoped IAM role from a CloudFormation template and can revoke it the day the report lands. No write, modify or delete permission is requested at any point. We see no application data, customer data, database contents or log payloads.
Is this a fit for your estate?
| Good fit | Probably not a fit |
|---|---|
| AWS spend above $40,000 a month | Under roughly $40,000 a month |
| Multiple accounts across production and non-production | A predominantly serverless estate |
| Significant EC2, RDS, EKS, S3 or CloudWatch footprint | A full-time FinOps function already running on a commercial cost platform |
| A bill that has grown noticeably in the last 6-12 months, with no dedicated FinOps function | An estate optimised within the last nine months |
We would rather tell you now than take an engagement that will not pay for itself.
Request a cost optimization assessment | Talk to us about your specific AWS environment.
Further reading
- AWS Well-Architected Framework: Cost Optimization Pillar - the design principles this programme structure follows.
- AWS Cost and Usage Reports - the hourly, resource-level billing dataset every finding is derived from.
- AWS Compute Optimizer - rightsizing recommendations across EC2, EBS, Lambda and Auto Scaling groups.
- What are Savings Plans? - how commitment, coverage and utilisation actually work.
- Related reading: Automate genome reporting: a secure lab pipeline on AWS - the same measurement-first discipline applied to a regulated clinical data platform.
*Orbitnexa is a technology consulting firm specialising in cloud migration, data modernisation and managed AWS services for regulated and high-growth industries. ISO/IEC 27001:2022 - ISO 9001:2015 - ISO/IEC 20000-1:2018.*